Members can access the Analytics tab with tailored insights based on their contributions and permissions.
Members can view:
Search Breakdown - view analytics for searches they performed.
Wikis & Collections - get insights on wikis and collections that they created.
Assistant Analytics - see usage of assistants that they created or have full access to.
API Analytics - data from API using assistants that they created or have full access to.
Note: Analytics are only available for viewing on the web app.
As a company admin, you can view your workspace's usage, most popular queries, top unsuccessful queries, and more from the Analytics tab. You can also access detailed information on users and departments.
The default time frame is set to the last 12 months, but you can adjust it to reflect the period most appropriate for your needs. The right-hand side displays dynamic filters for the report. To refine the reports and display specific variables, select the appropriate filters for each report.
Users
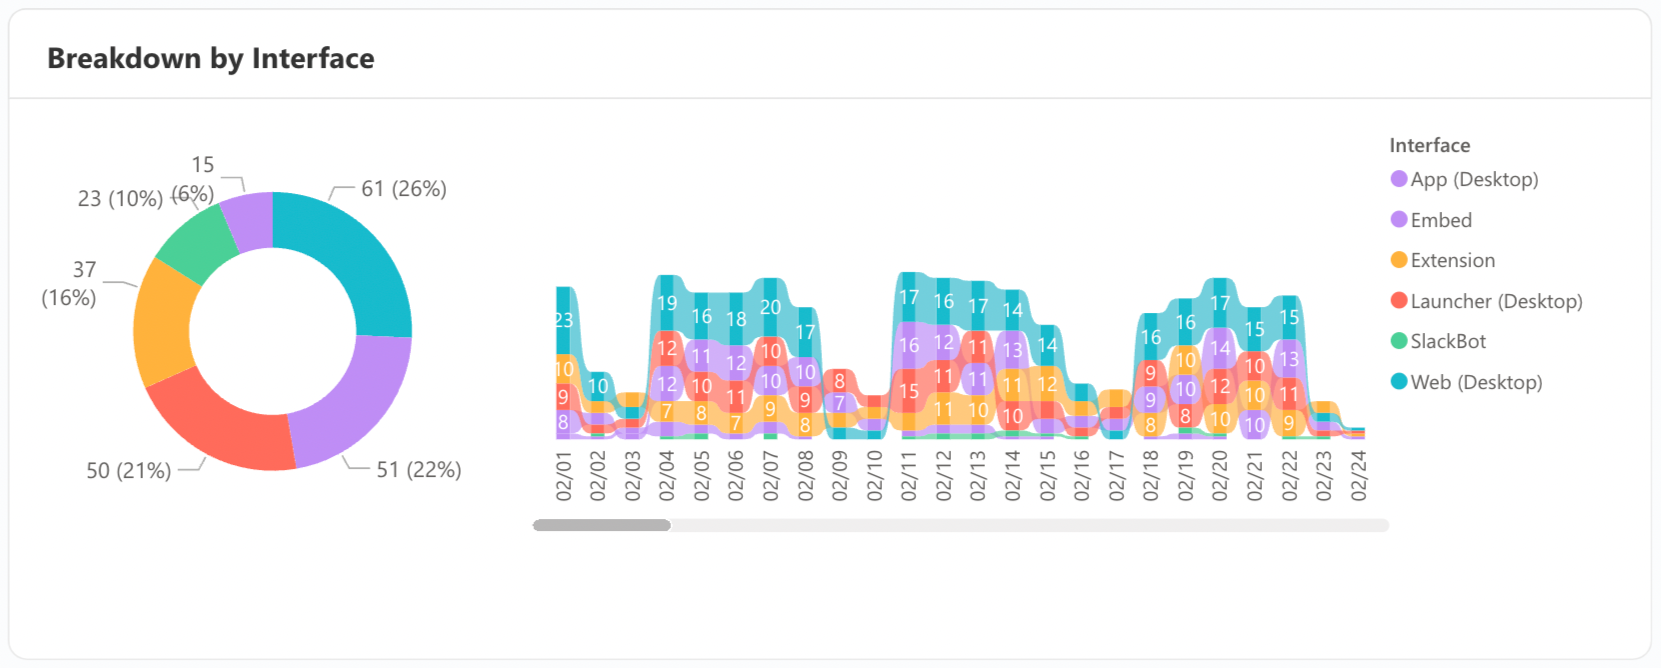
Breakdown by Interface
View the number and percentage of users in your workspace using the various Unleash interfaces daily. This breakdown helps you understand user engagement and interface preferences.
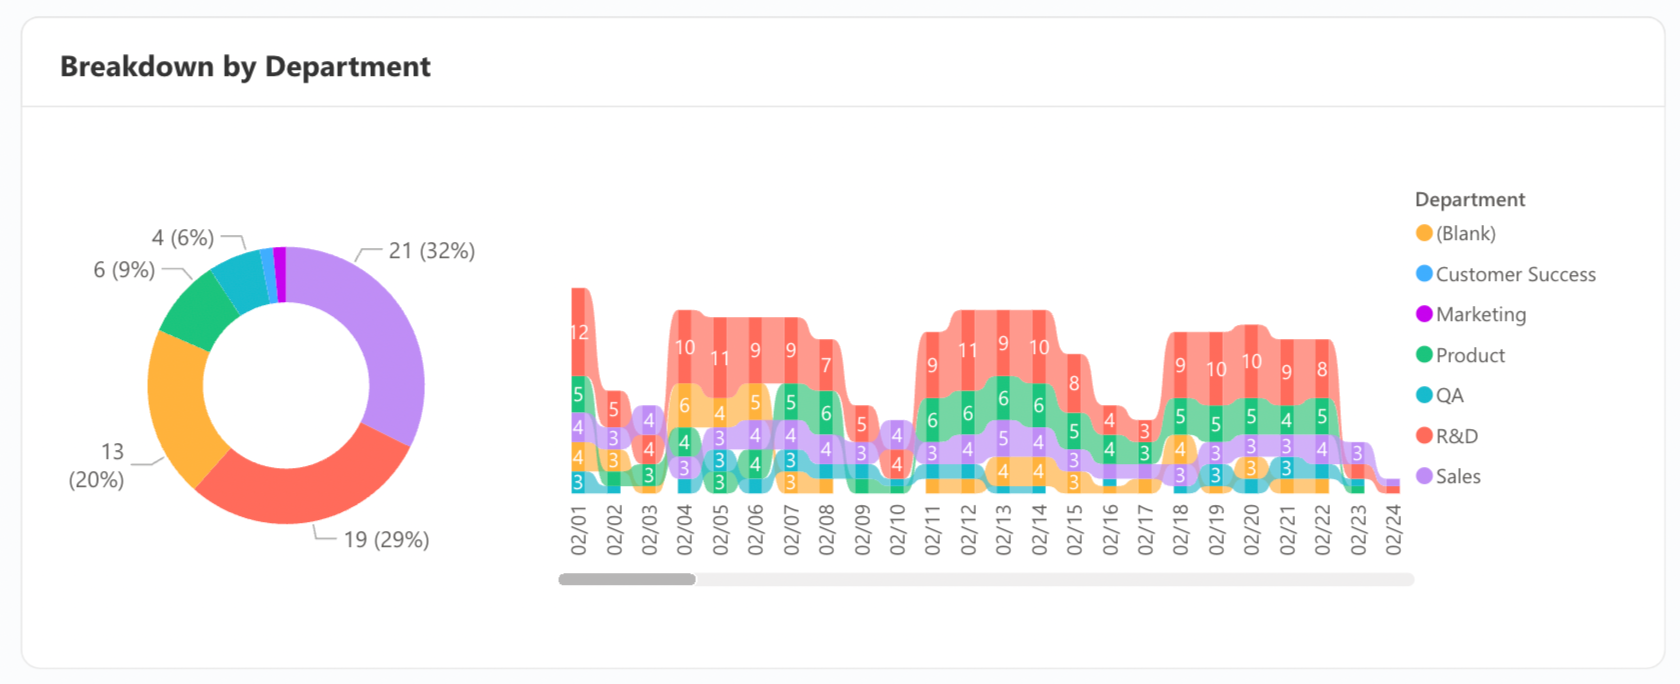
Breakdown by Department
View the number of users per department utilizing Unleash. This breakdown helps you understand departmental engagement and platform usage, allowing for better resource allocation and support.
Search Overview
Search Trend
Track the number of searches conducted each day. This metric provides insights into search activity trends, helping you understand user behavior and the overall demand for information.

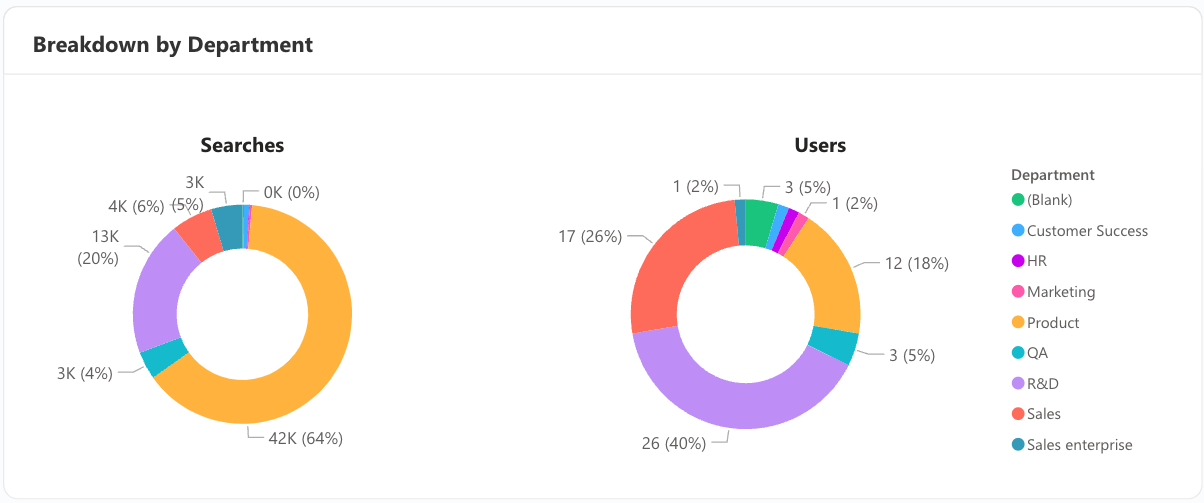
Breakdown by Department
View a detailed breakdown of search activity by department, including the number of searches conducted and the number of users performing searches in each department. This data helps you understand departmental search behavior and identify which teams are most actively seeking information.
Breakdown by Role
View a detailed breakdown of search activity by role in Unleash. See the number of searches conducted by each role and the number of users performing searches in that role. This information helps you understand search behavior across different roles and identify which roles are most actively seeking information.
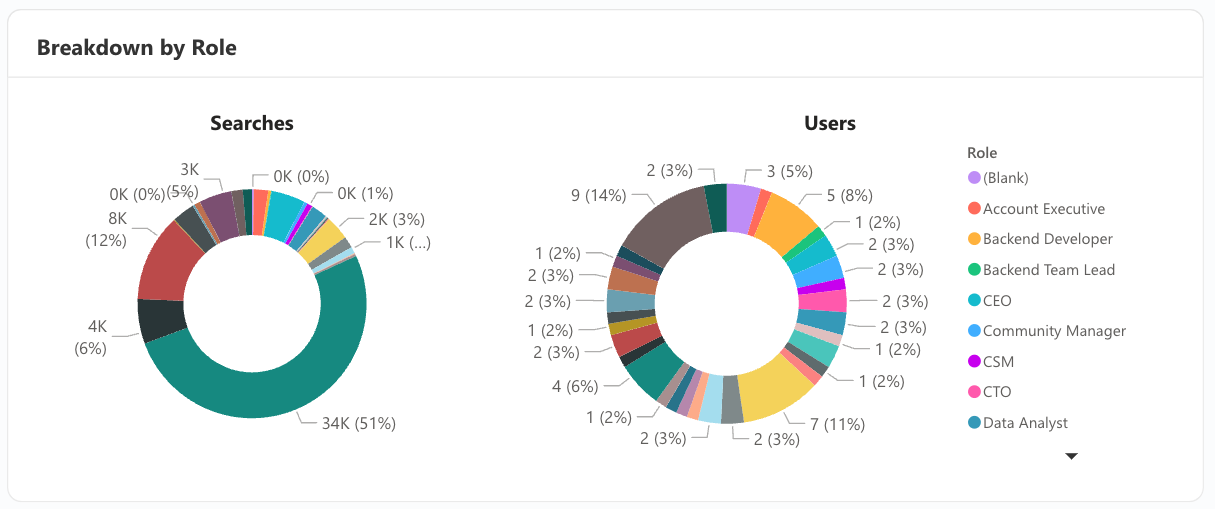
Search Breakdown
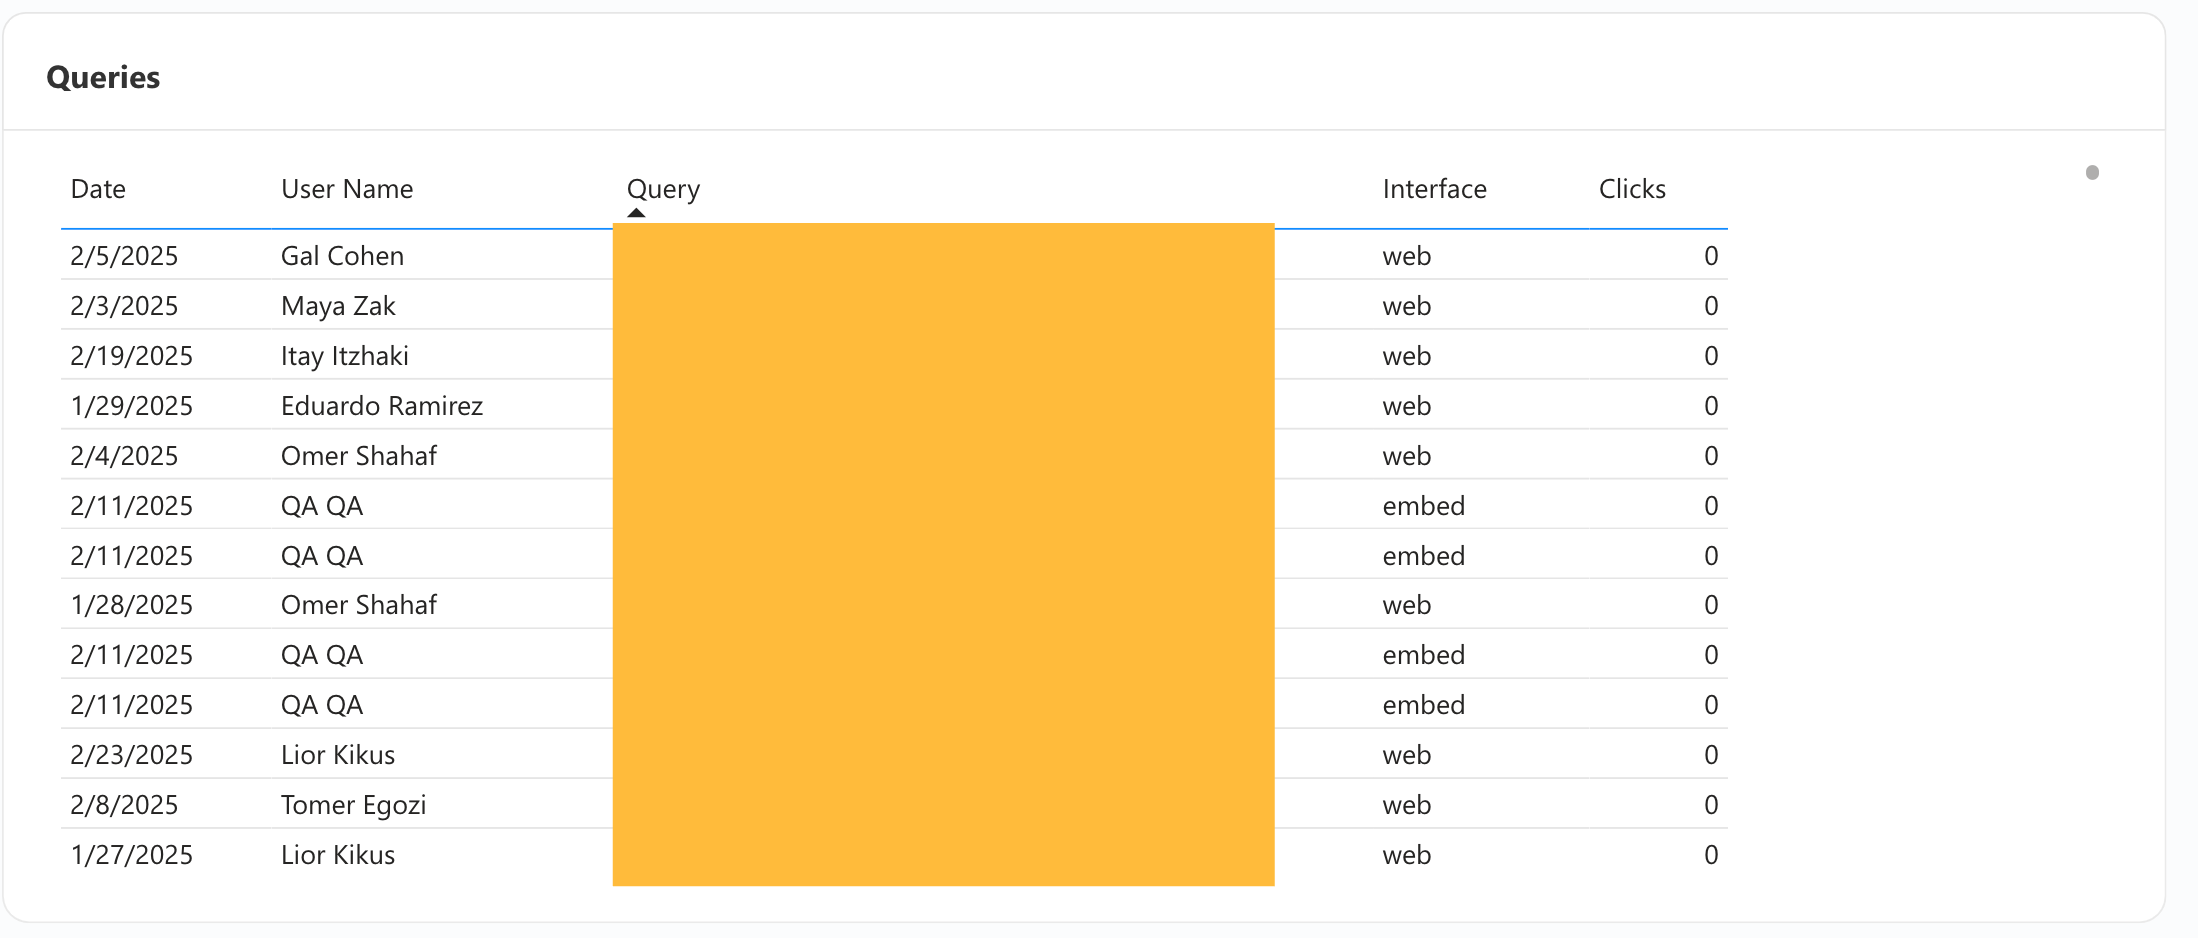
Queries
Analyze the overall sentiment of feedback provided resources provided to queries. This helps identify trends in helpfulness and areas for improvement in your knowledge base.
Search Results Feedback Trend
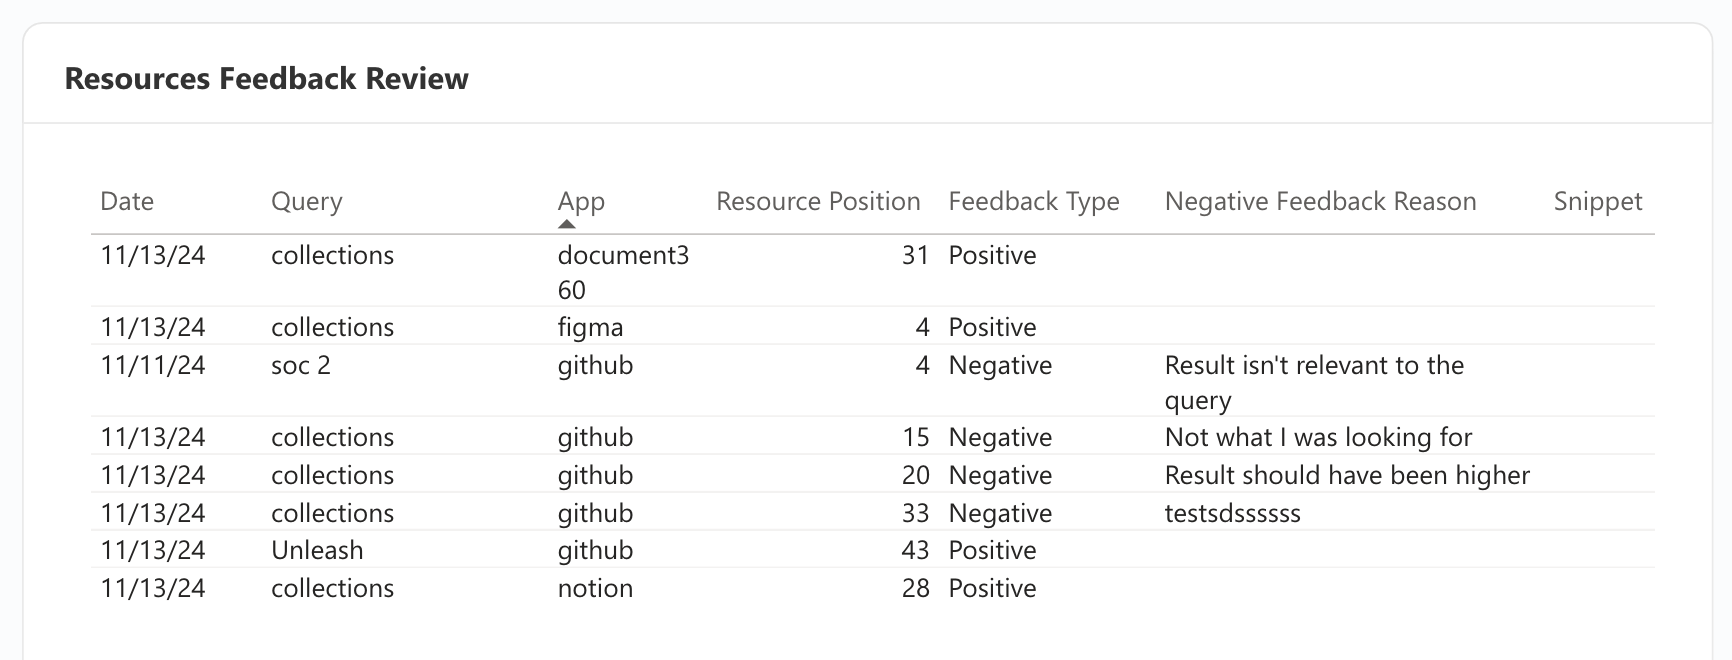
Dive into detailed feedback on resource performance, including the query, source app, feedback type, and reasons for negative feedback. Use these insights to refine resource accuracy and relevance.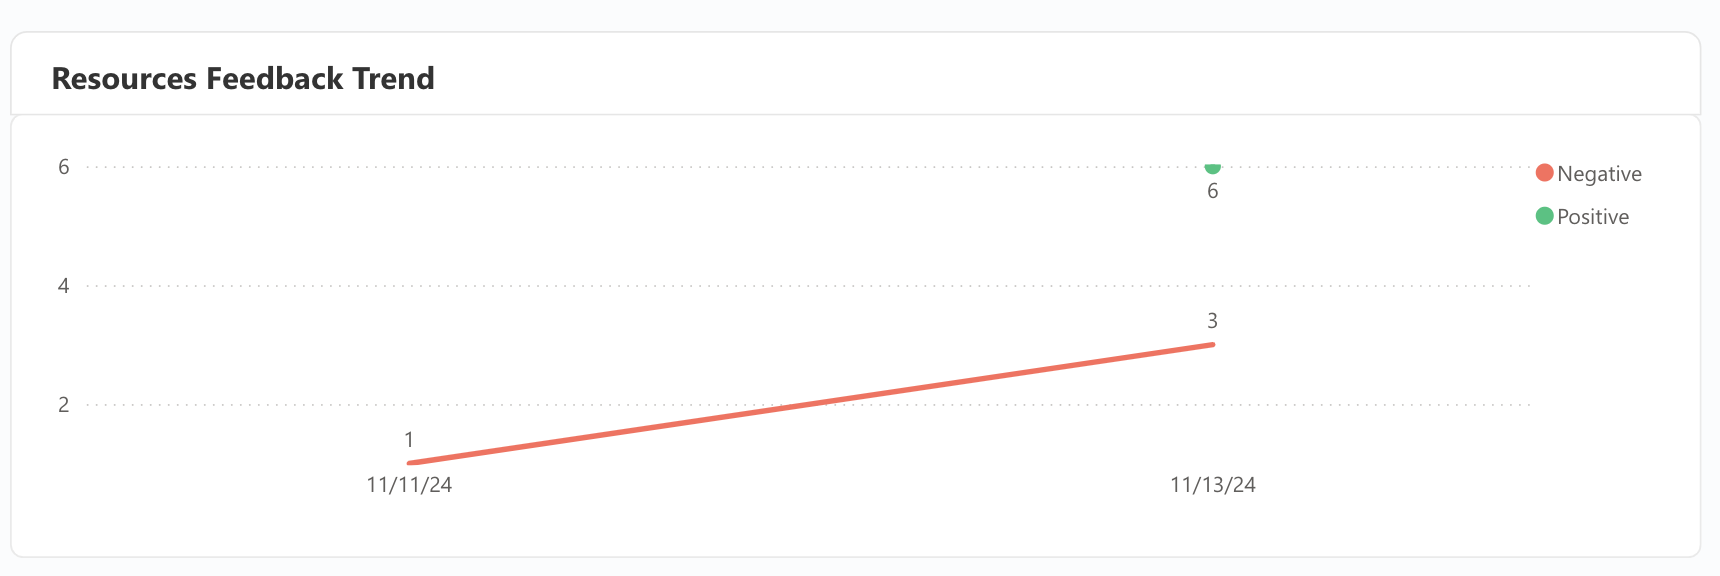
Search Results Feedback
View a review of resource feedback highlighting the reasons for negative feedback when the answer was marked unhelpful.
Collections
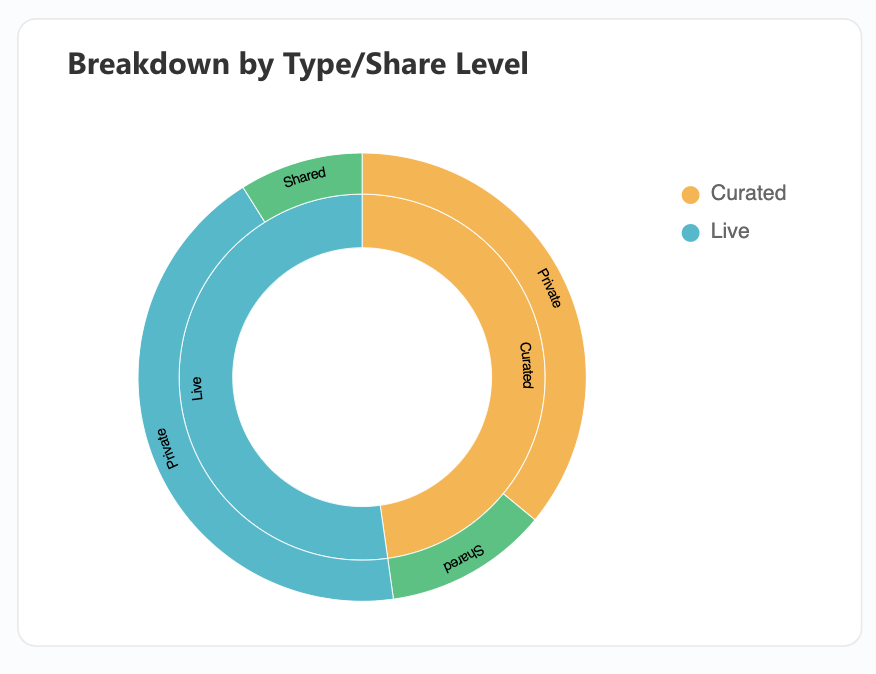
Breakdown by Type/Share Level
Explore the types of collections created, distinguishing between shared and private collections. Understand how many collections exist for each type and their sharing status within your workspace.
Creation Trend
Track the creation trend for each type of collection over time.

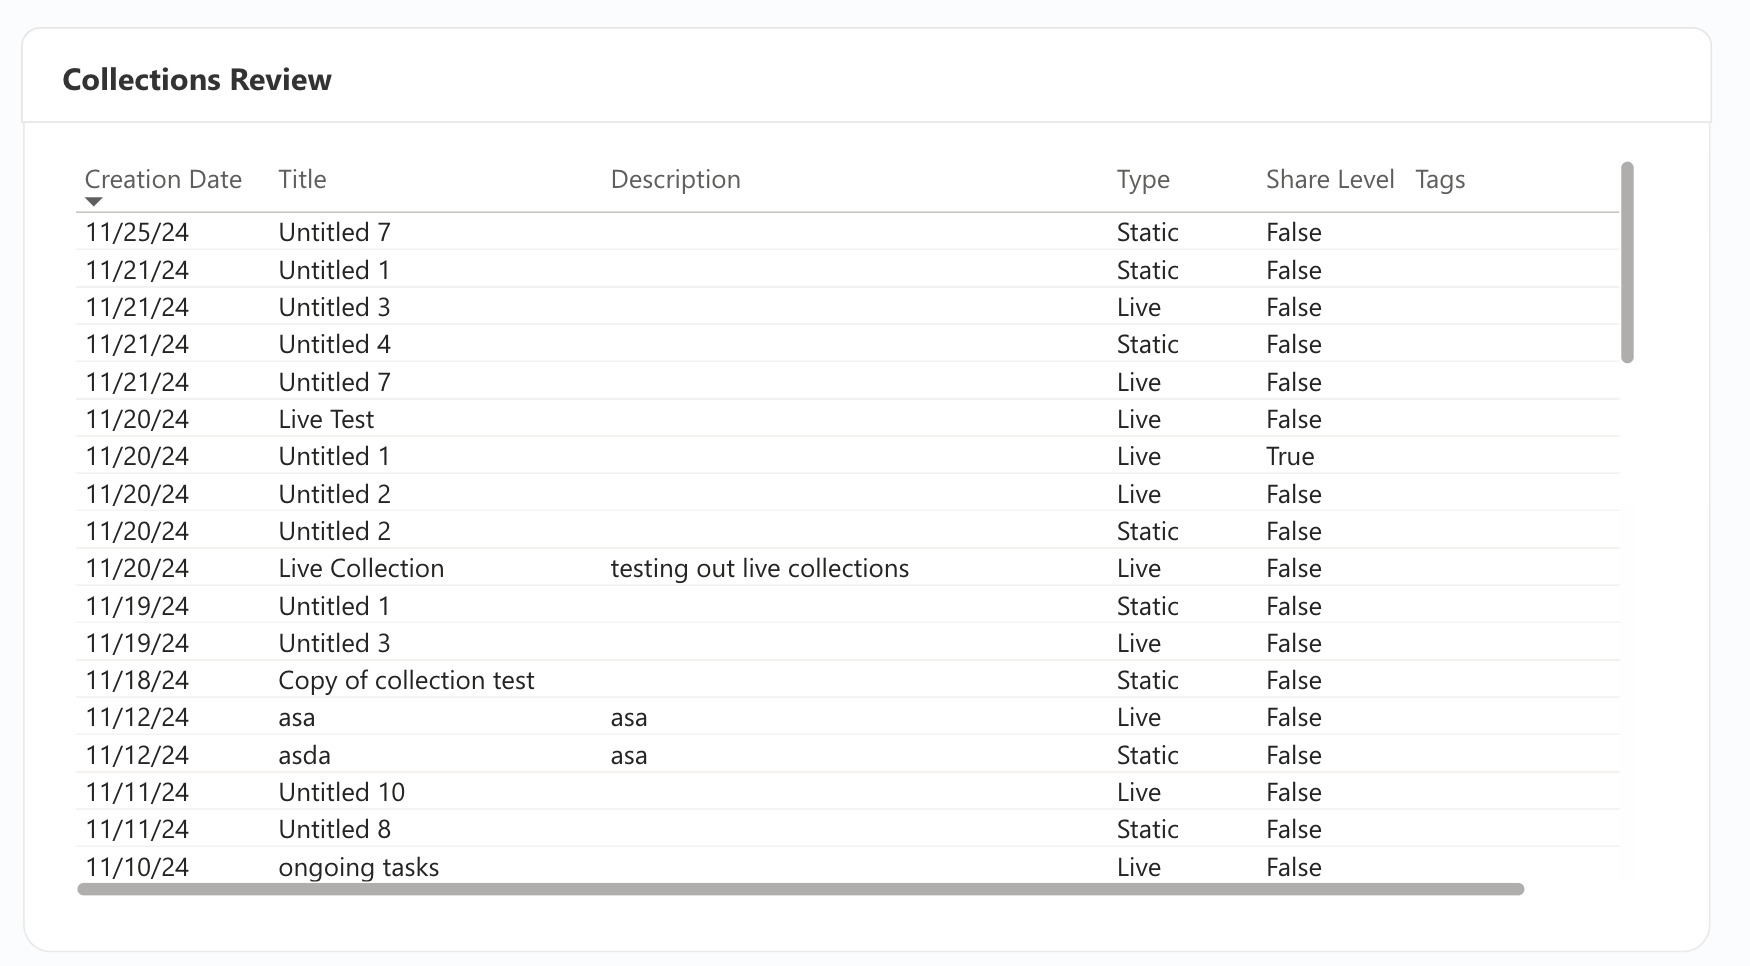
Collections Review
Explore the titles, types, sharing settings, and tags associated with collections in your workspace. This report provides a comprehensive overview of each collection’s organization and access settings.
Wikis
Card Creation Trend
Track the creation trend of cards over time.

Card Views Trend
Understand how many cards are viewed per day in your workspace.

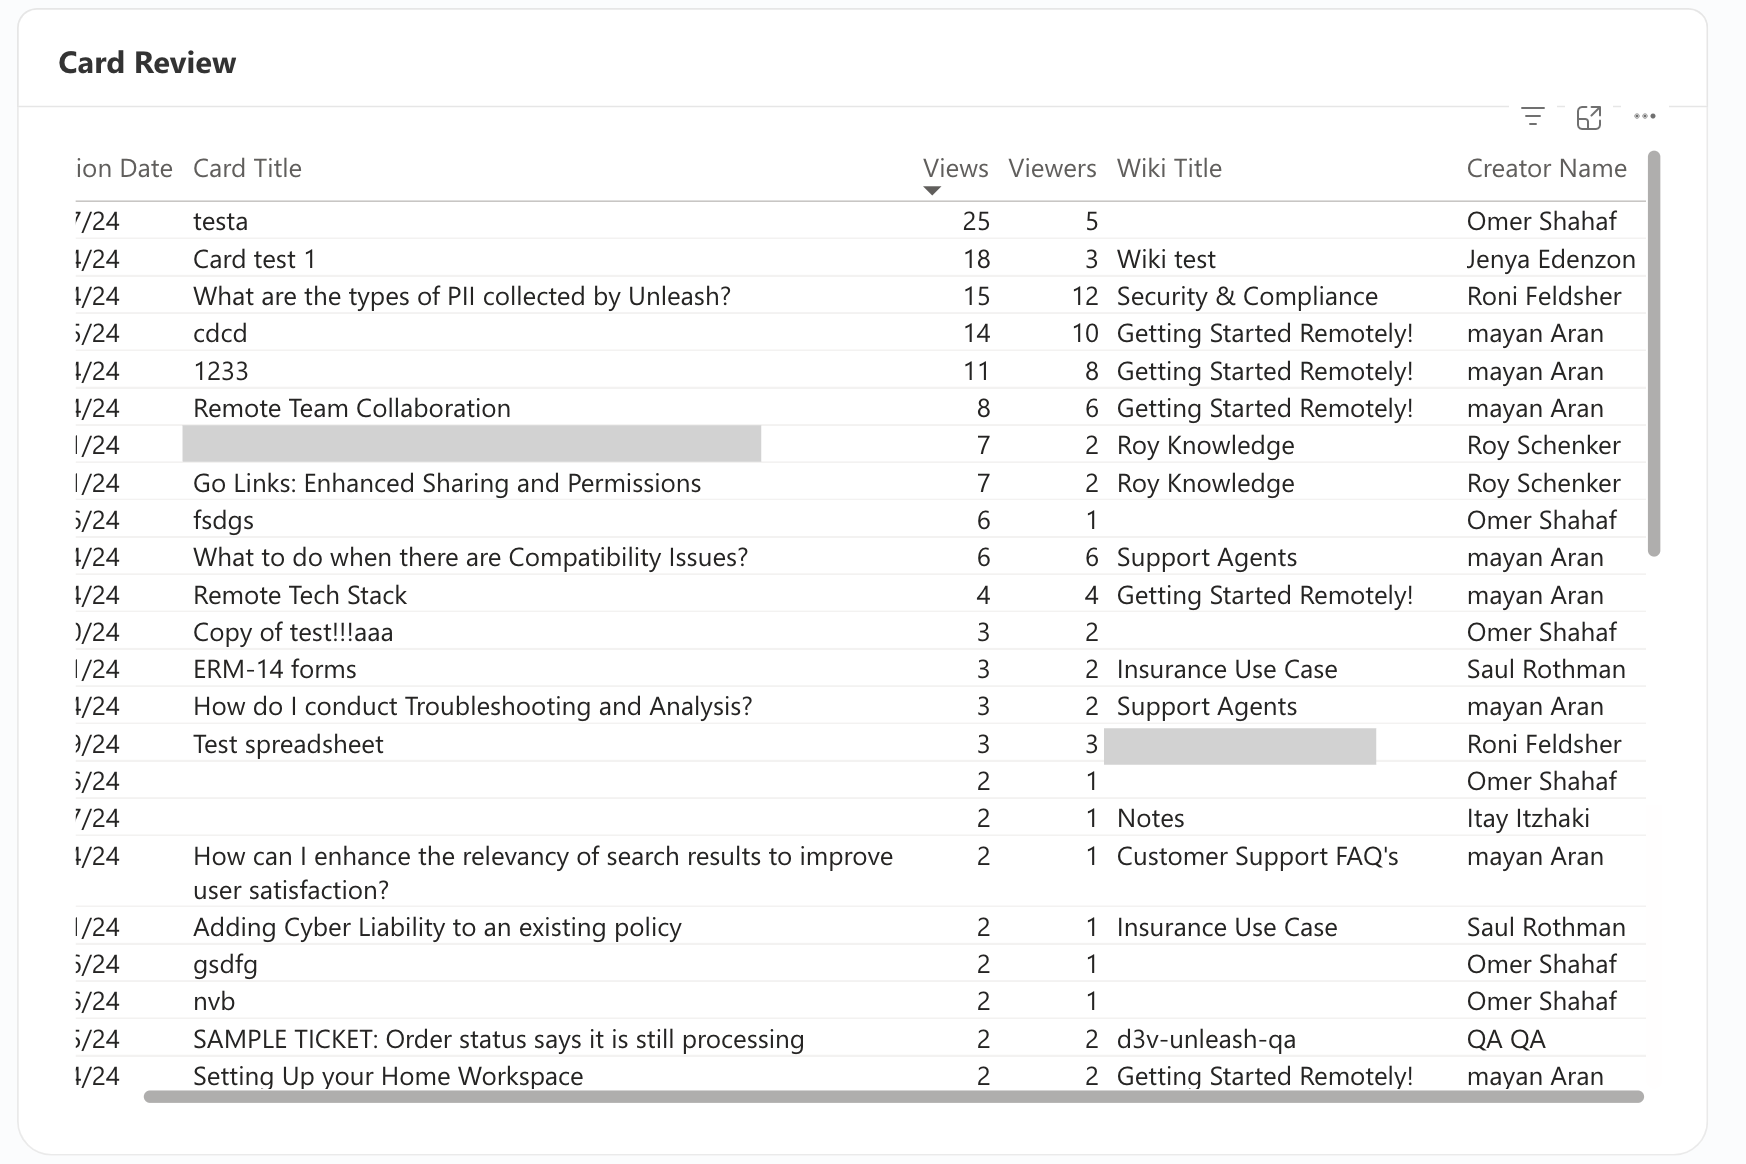
Card Review
Explore the creation date, titles, views, viewers, Wiki title, creator name for cards in your workspace.
Go Links
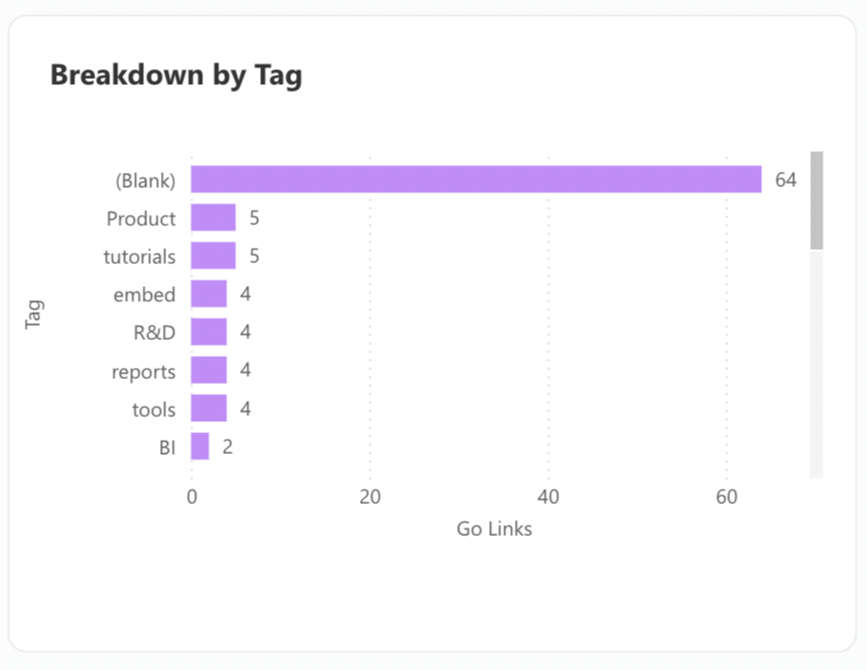
Breakdown by Tag
Explore the various tags and see how many of each tag is assigned to the Go Links created in your workspace.
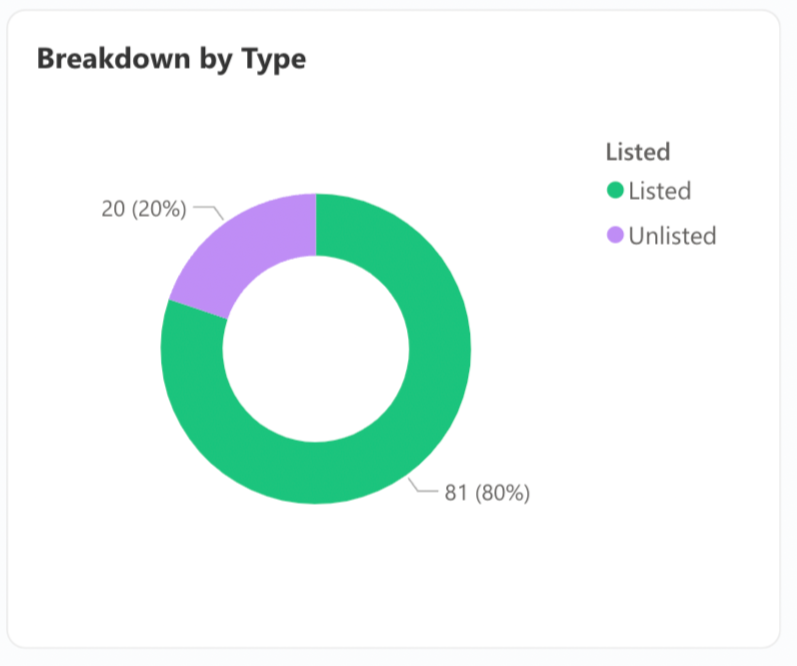
Breakdown by Type
View the number of Go Links marked as listed or unlisted.
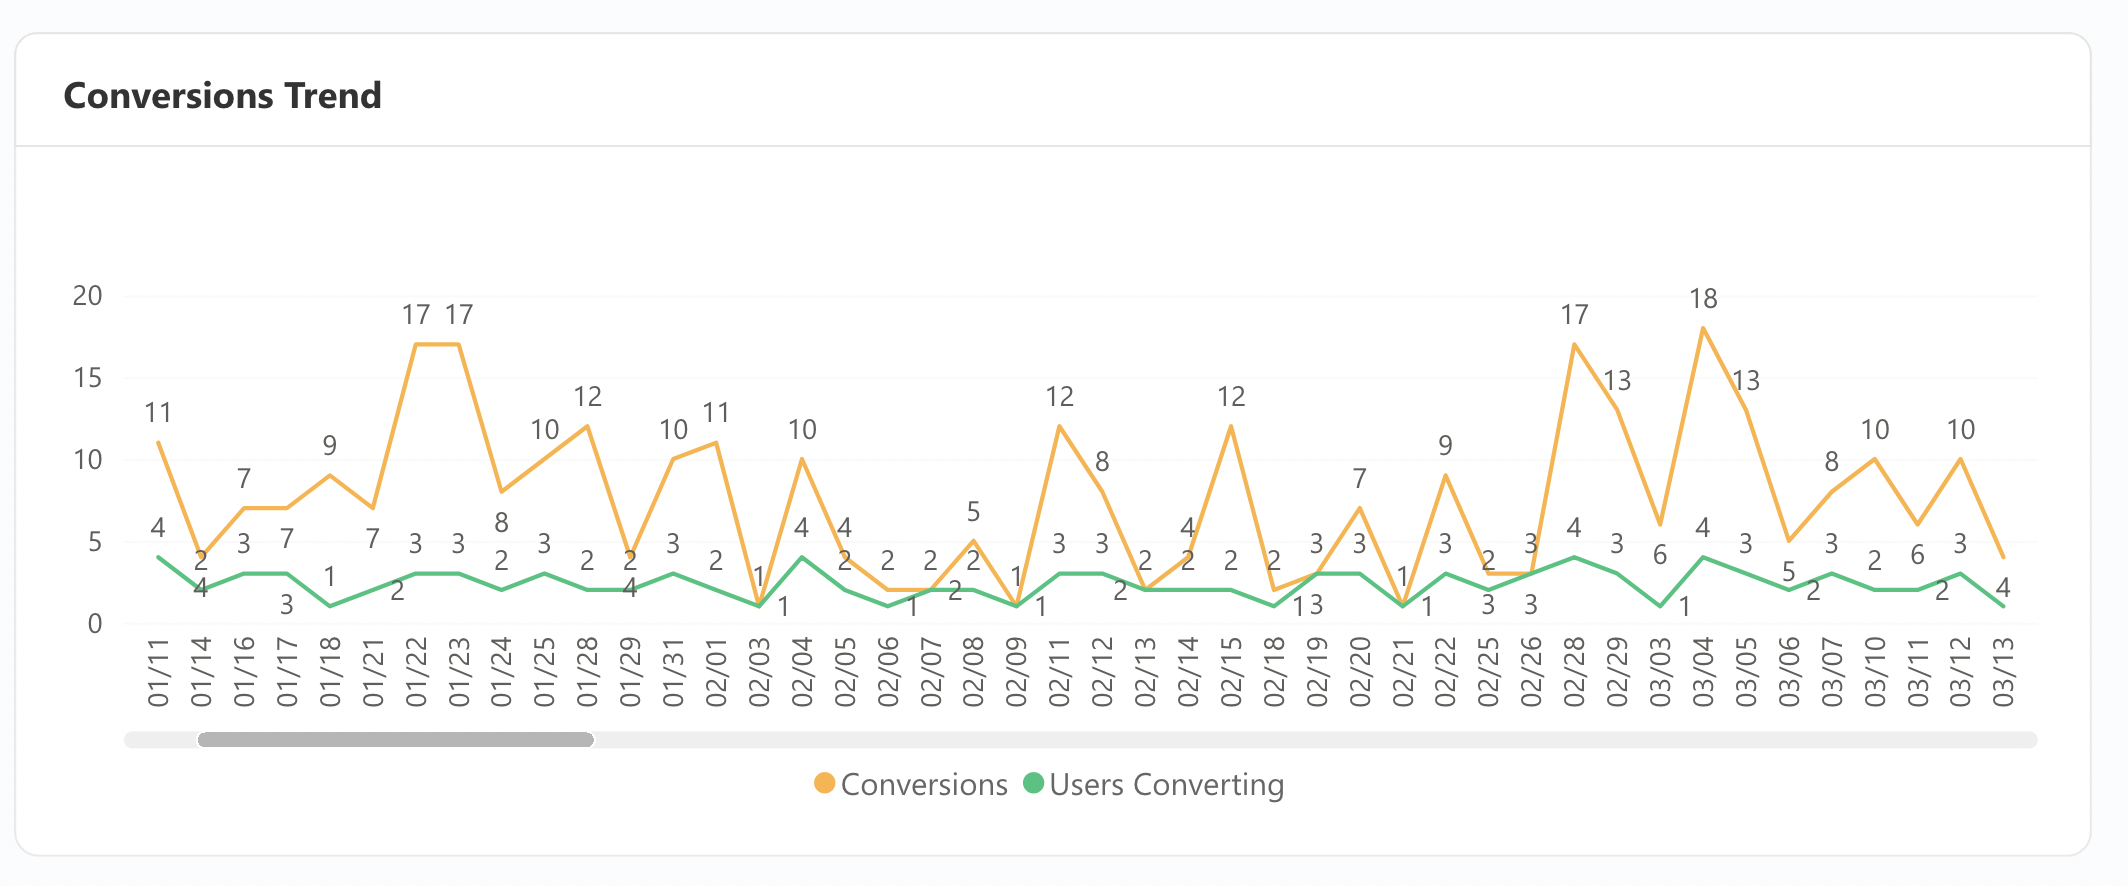
Conversions Trend
Track the conversion trends for Go links, including:
Conversions: The number of times a Go link was clicked.
User Converting: The number of users who collectively clicked on a Go link from Unleash.
Assistants
The analytics from this tab can help you identify where documentation is missing or incorrect by reviewing negative feedback and the reasons for it. By analyzing this feedback, you can pinpoint areas for improvement within your documentation. We recommend checking this tab weekly or monthly to identify gaps and enhance your documentation accordingly.
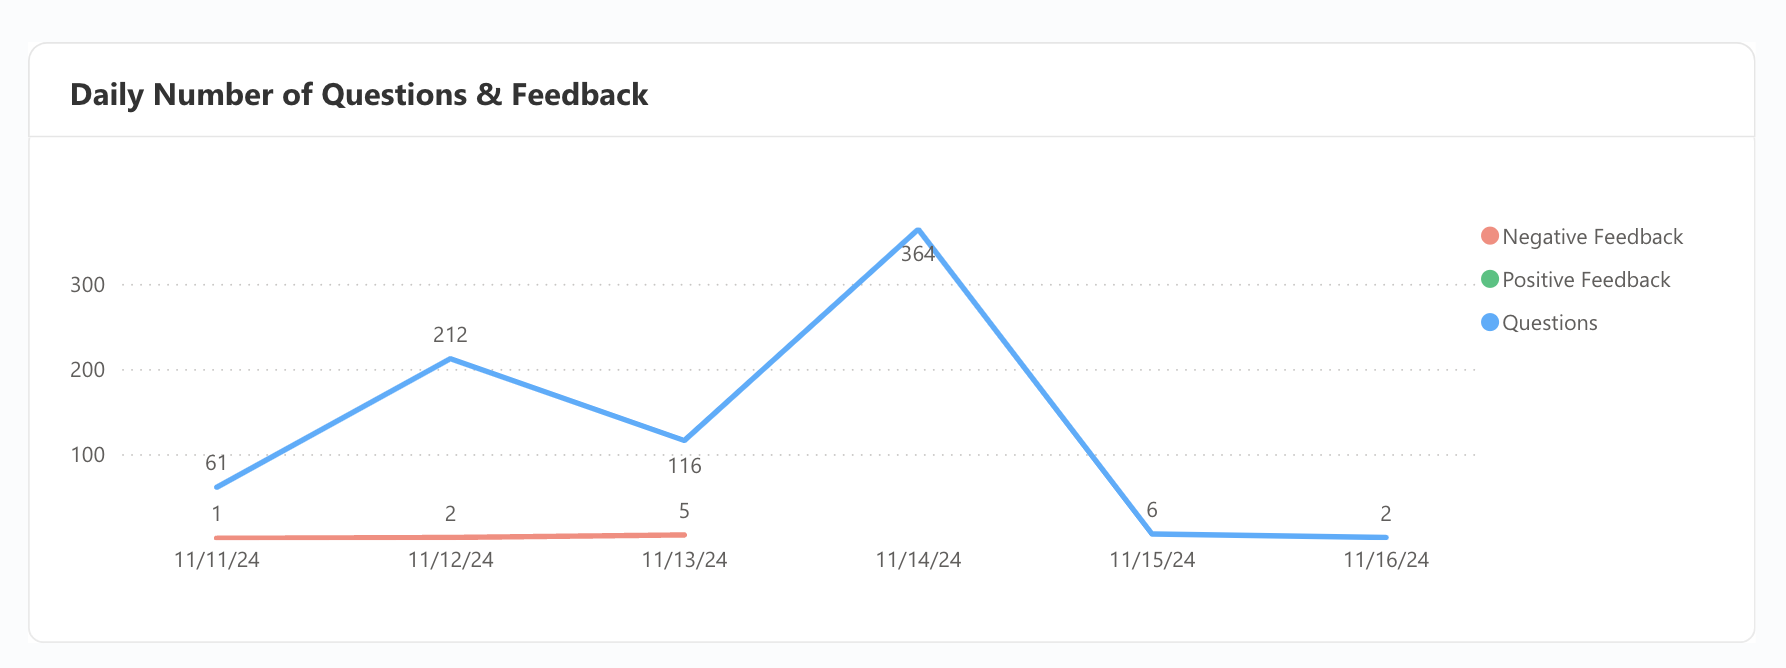
Daily Number of Questions & Feedback
Track the number of questions asked daily and analyze the correlation between the total questions and those marked with positive or negative feedback regarding answer quality. This report helps assess the effectiveness of responses and user satisfaction with the provided answers.
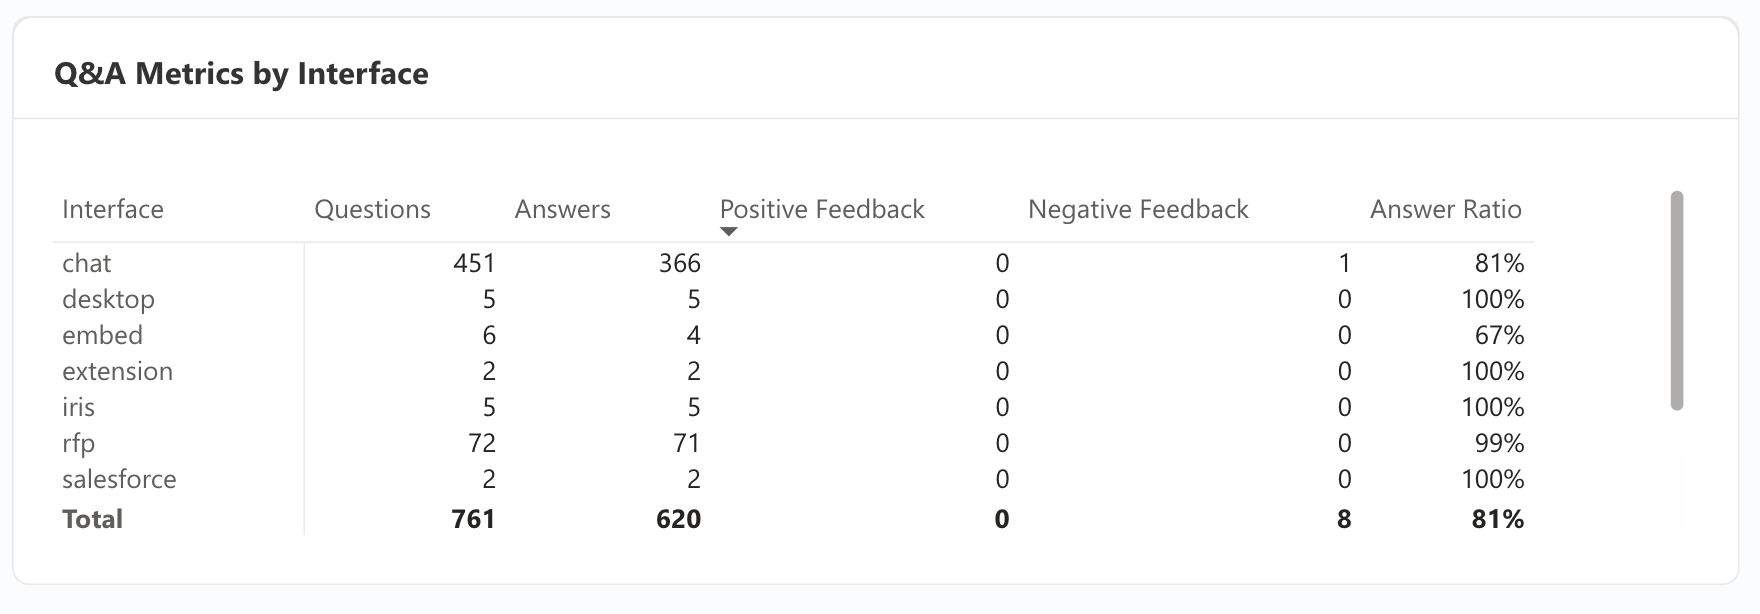
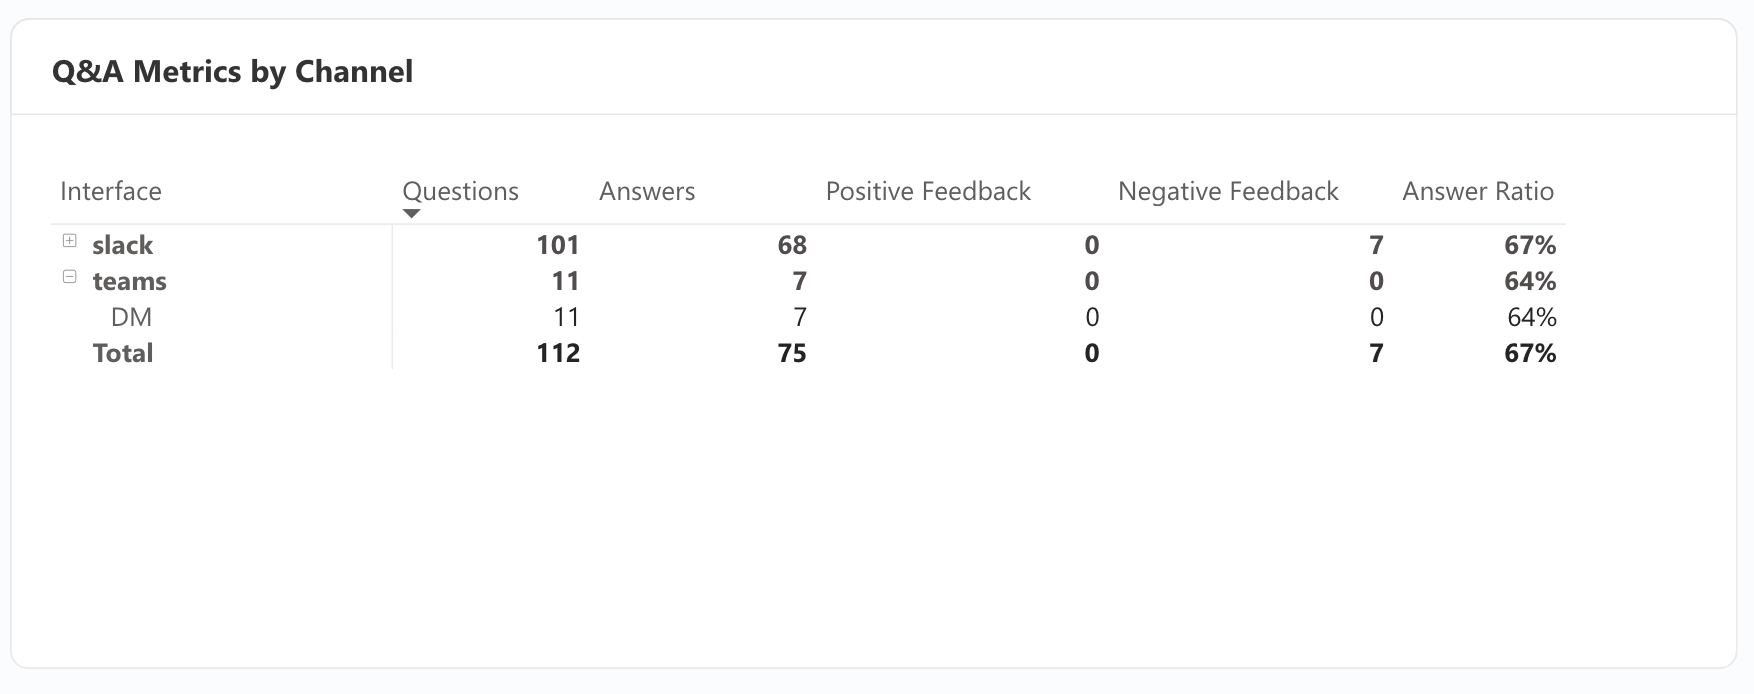
Q&A Metrics by Interface
This table provides insights into:
Interface Usage: The interface where most queries are asked.
Query and Answer Metrics: The total number of queries asked and answered.
Feedback: The number of positive and negative reactions to the answers.
Resource Clicks: How many times users clicked the resource from which the answer was sourced.
Answer Rate: The percentage of answers delivered relative to the number of queries asked.
These metrics help you understand user engagement and the effectiveness of your Q&A documentation.
Q&A Metrics per Channel/Assistant
View the percentage of answers marked as positive or negative for the different Slack/Team channels you have invited the bot to. This metric helps you understand user satisfaction and the accuracy of responses provided.
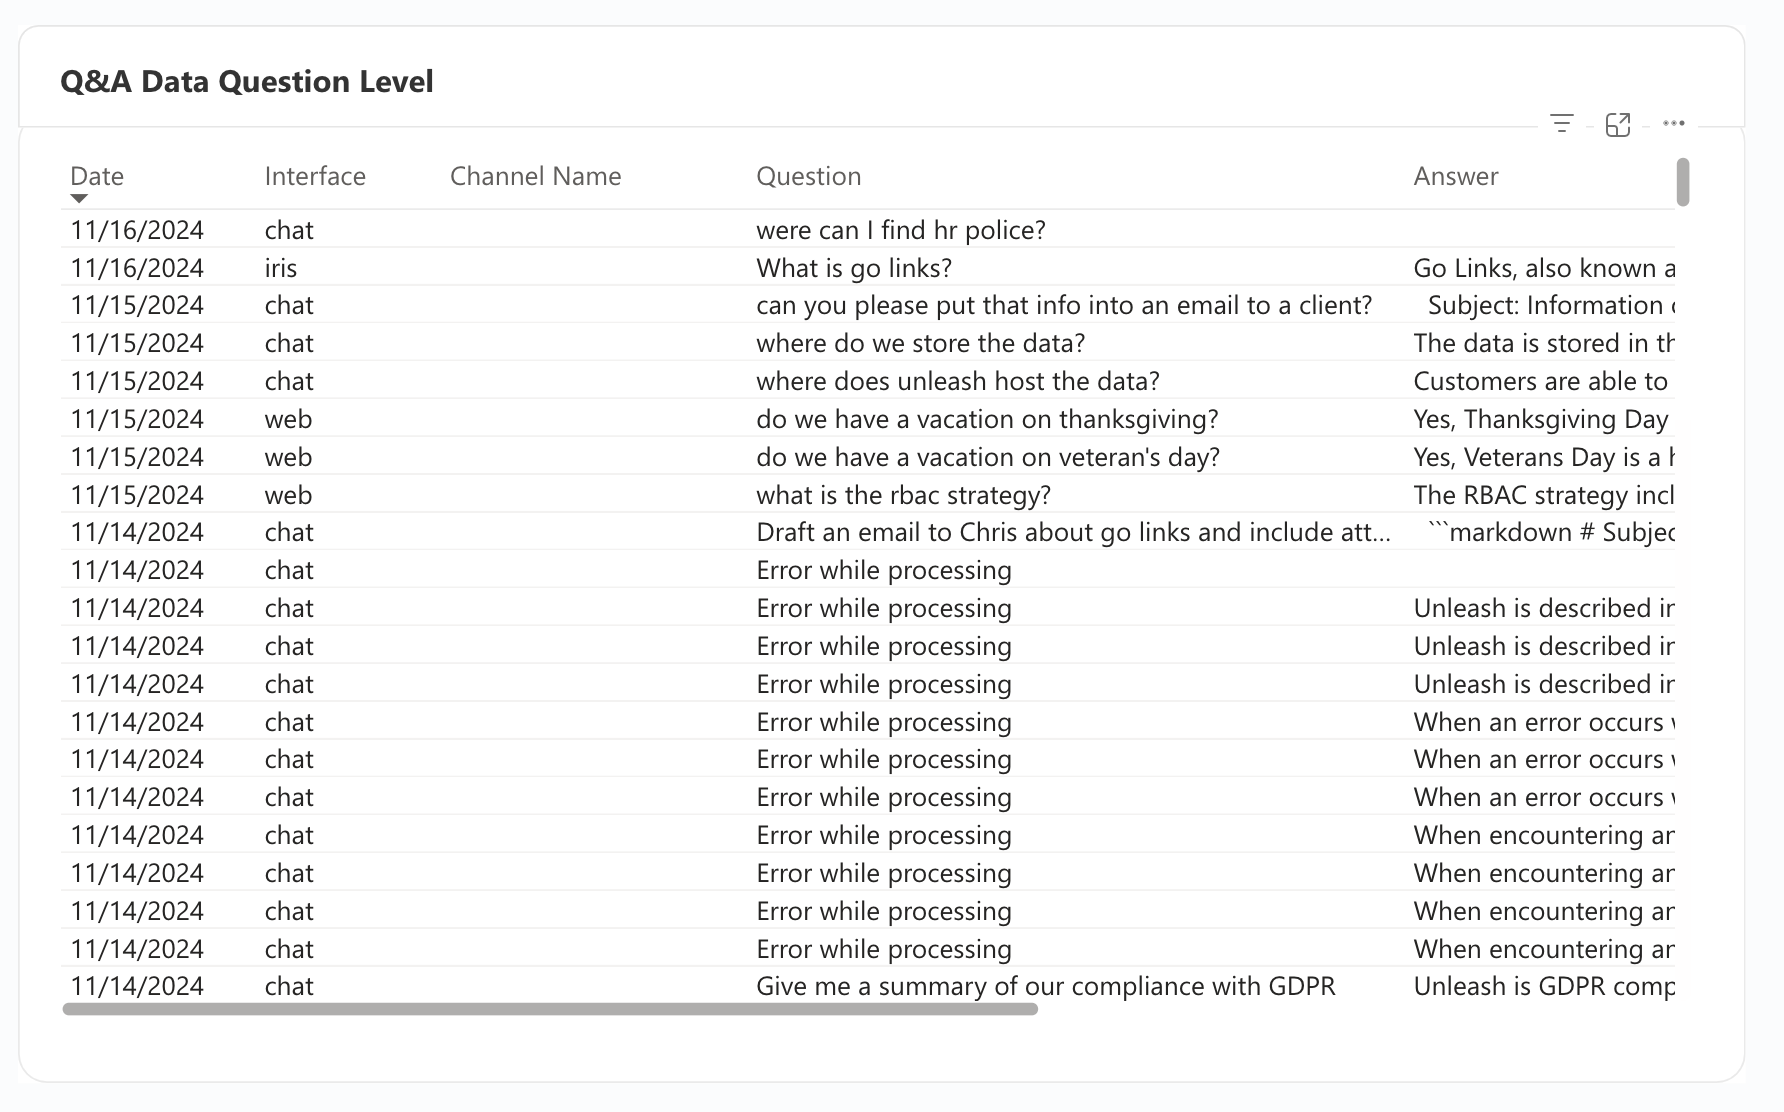
Q&A Data Question Level
Access a comprehensive list of queries and answers asked in your interfaces. This includes:
Time Stamp: The date and time the question was asked.
Interface Information: The interface where the query was asked.
User Name: Account name of user that asked the query.
Query: The actual query that was asked.
Answer: Answer provided to the query.
Feedback: Whether the query received positive or negative feedback.
Reason: The reasons given for the feedback sentiment.
Channel Name: The specific channel name the query was asked.
Assistant: The specific assistant asked.
Department:
Role: The role of the user asking the query.
Sources: The apps/sources used to provide the answer from.
This detailed view allows you to improve documentation for unanswered queries and queries with negatively marked answers.
External Assistants
Breakdown by Department
View the number of users per department utilizing External Assistants. This breakdown helps you understand departmental engagement and platform usage, allowing for better resource allocation and support.

Breakdown by Role
View a detailed breakdown of external assistant use by role in Unleash. See the number of searches conducted by each role and the number of users performing searches in that role. This information helps you understand search behavior across different roles and identify which roles are most using external assistants .
.
Query Trend
Track the trend of queries asked over time.

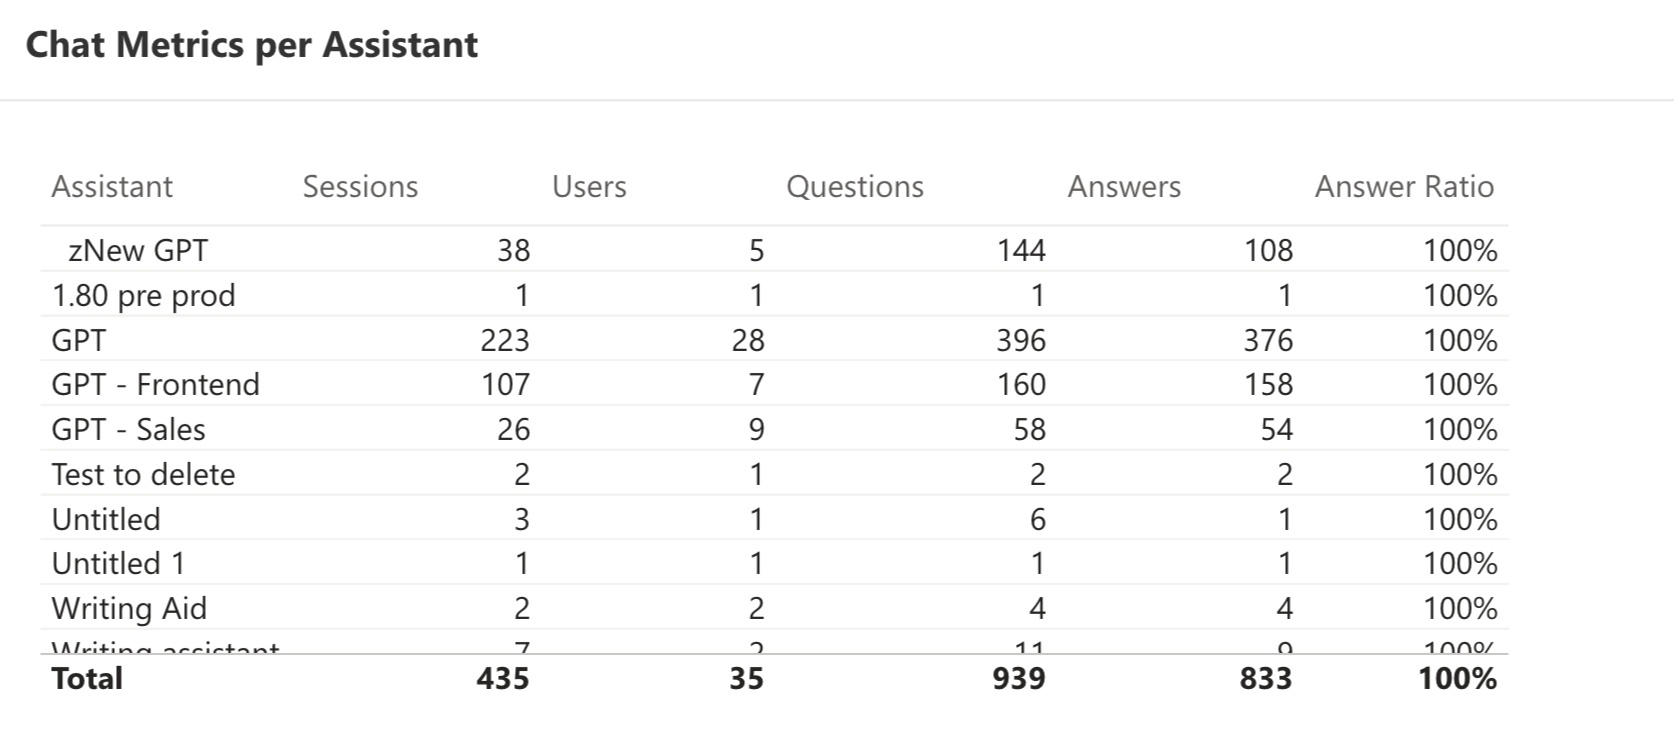
Chat Metrics
View key metrics for each assistant within a thread, including the total number of queries asked, the number of users who interacted with the assistant, the total answers generated in the chat, and the overall answer ratio. By analyzing this data, you can optimize assistants and improve user satisfaction.
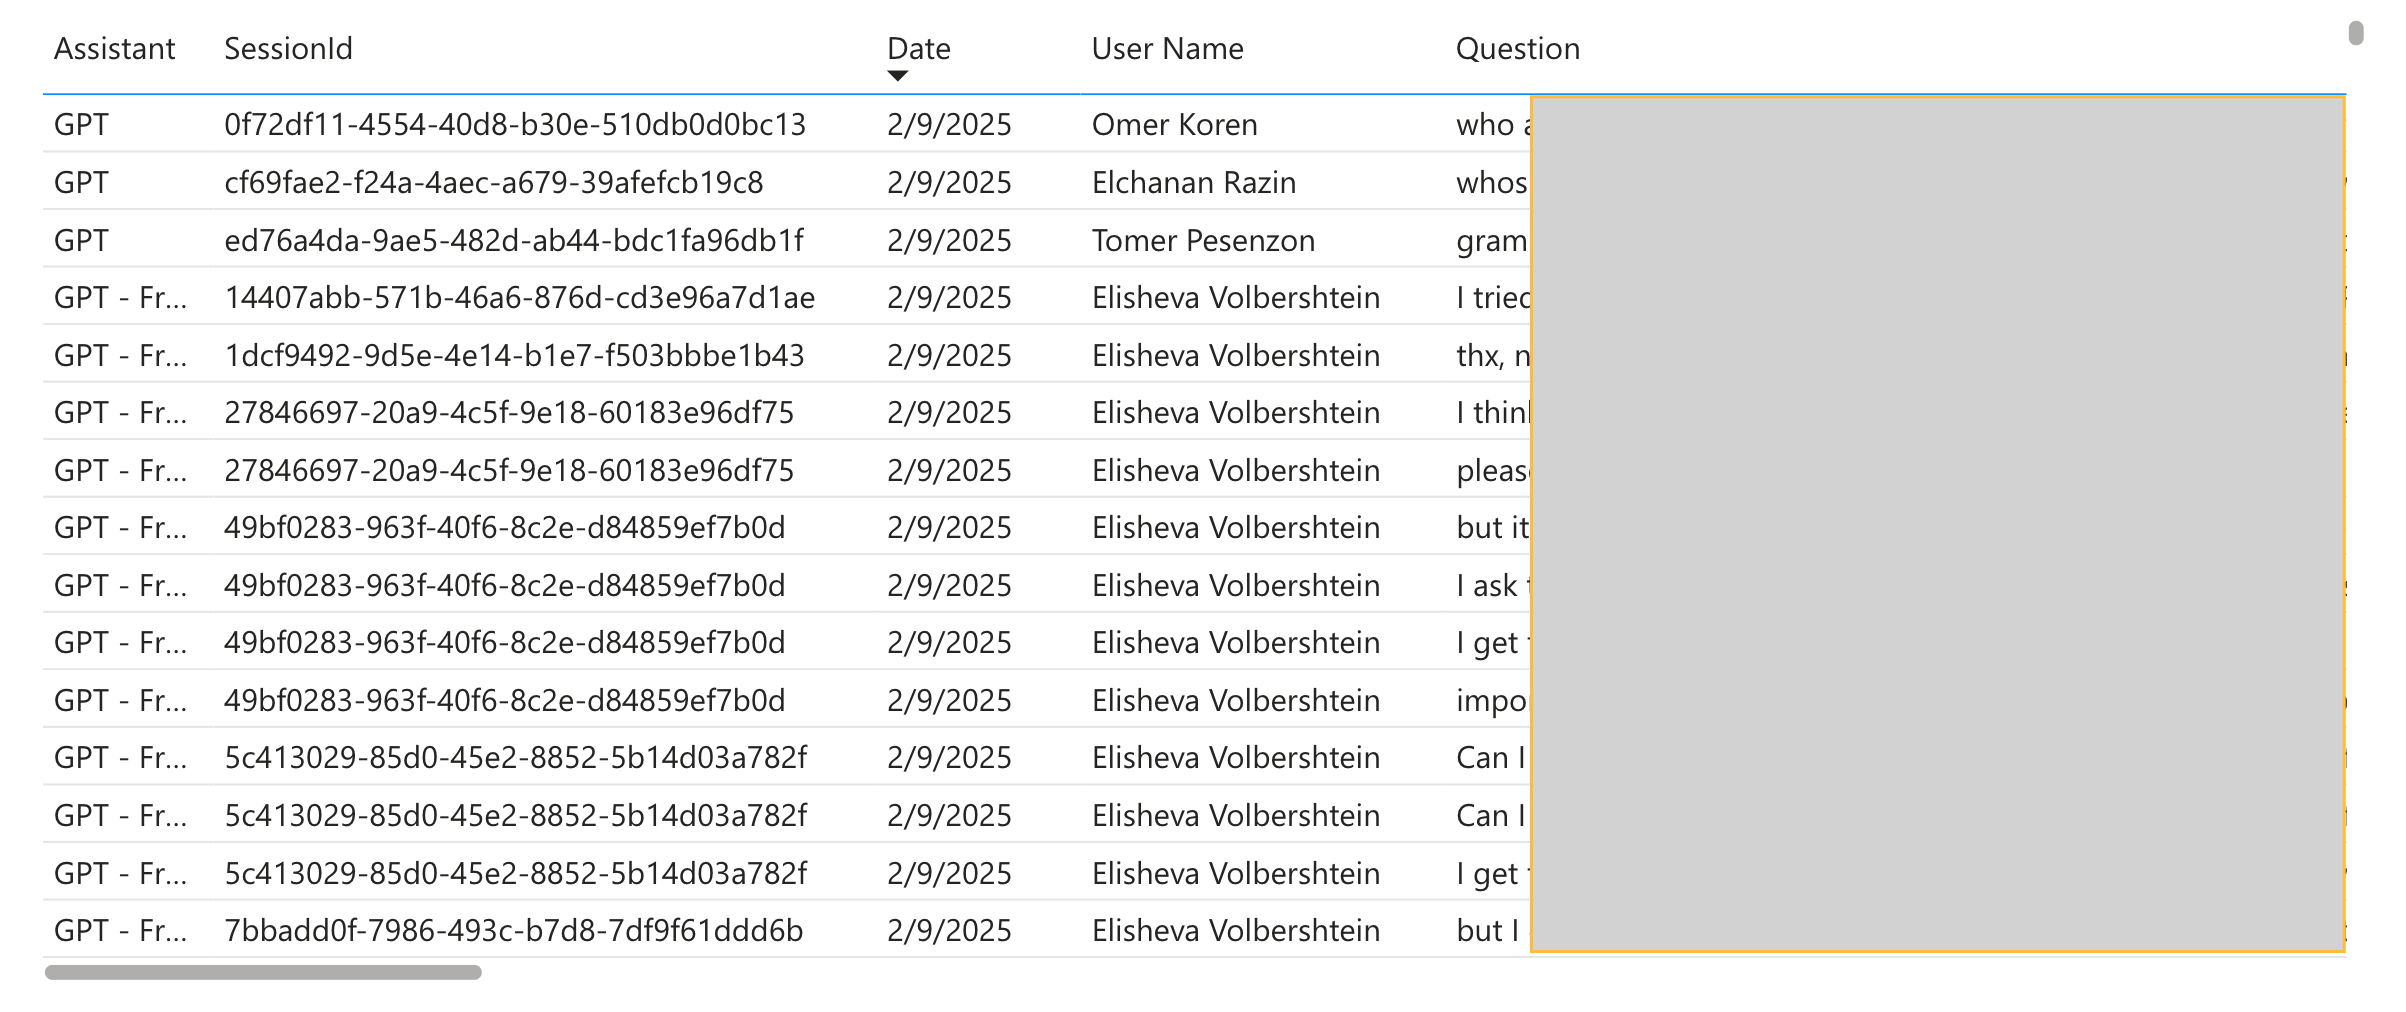
Query Breakdown
This graph allows you to view the chat name, thread details, the user who asked the query and date alongside the query asked; the answer provided, and feedback insights such as positive and negative responses. It provides valuable context for understanding the types of query being asked and the volume of queries within each thread, helping you identify patterns, trends, and opportunities for improvement.
Tickets
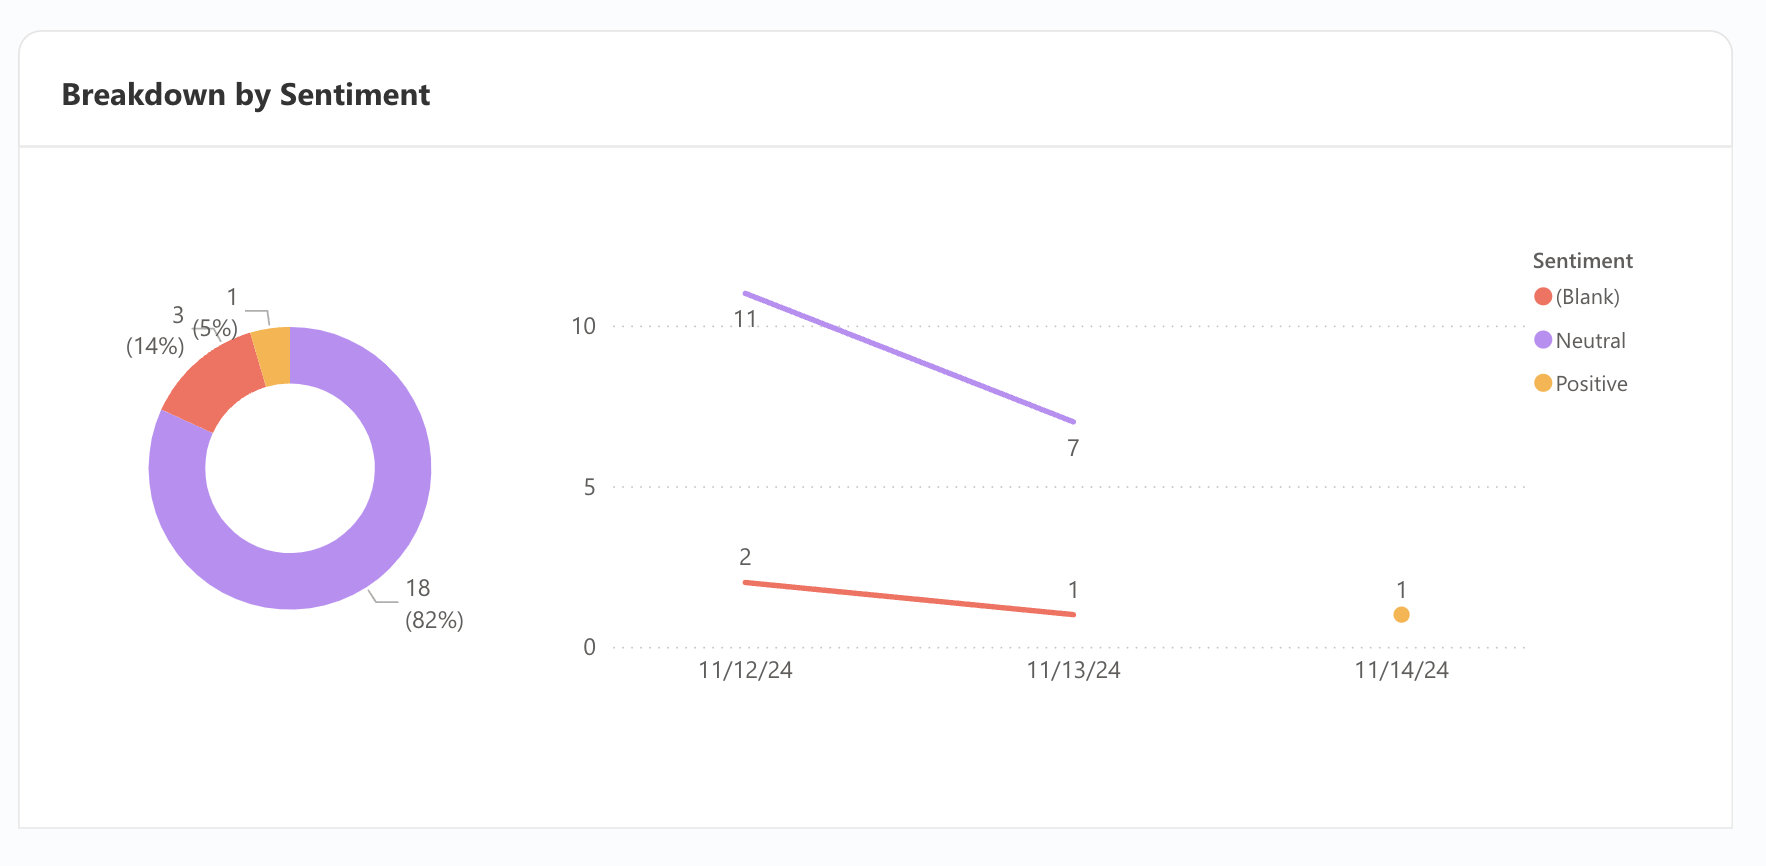
Breakdown by Sentiment
View answers provided to your Zendesk tickets and Salesforce cases with corresponding sentiment rating, indicating whether the bot’s suggestions were helpful. A blank sentiment status refers to suggestions that were not rated as either helpful or unhelpful.
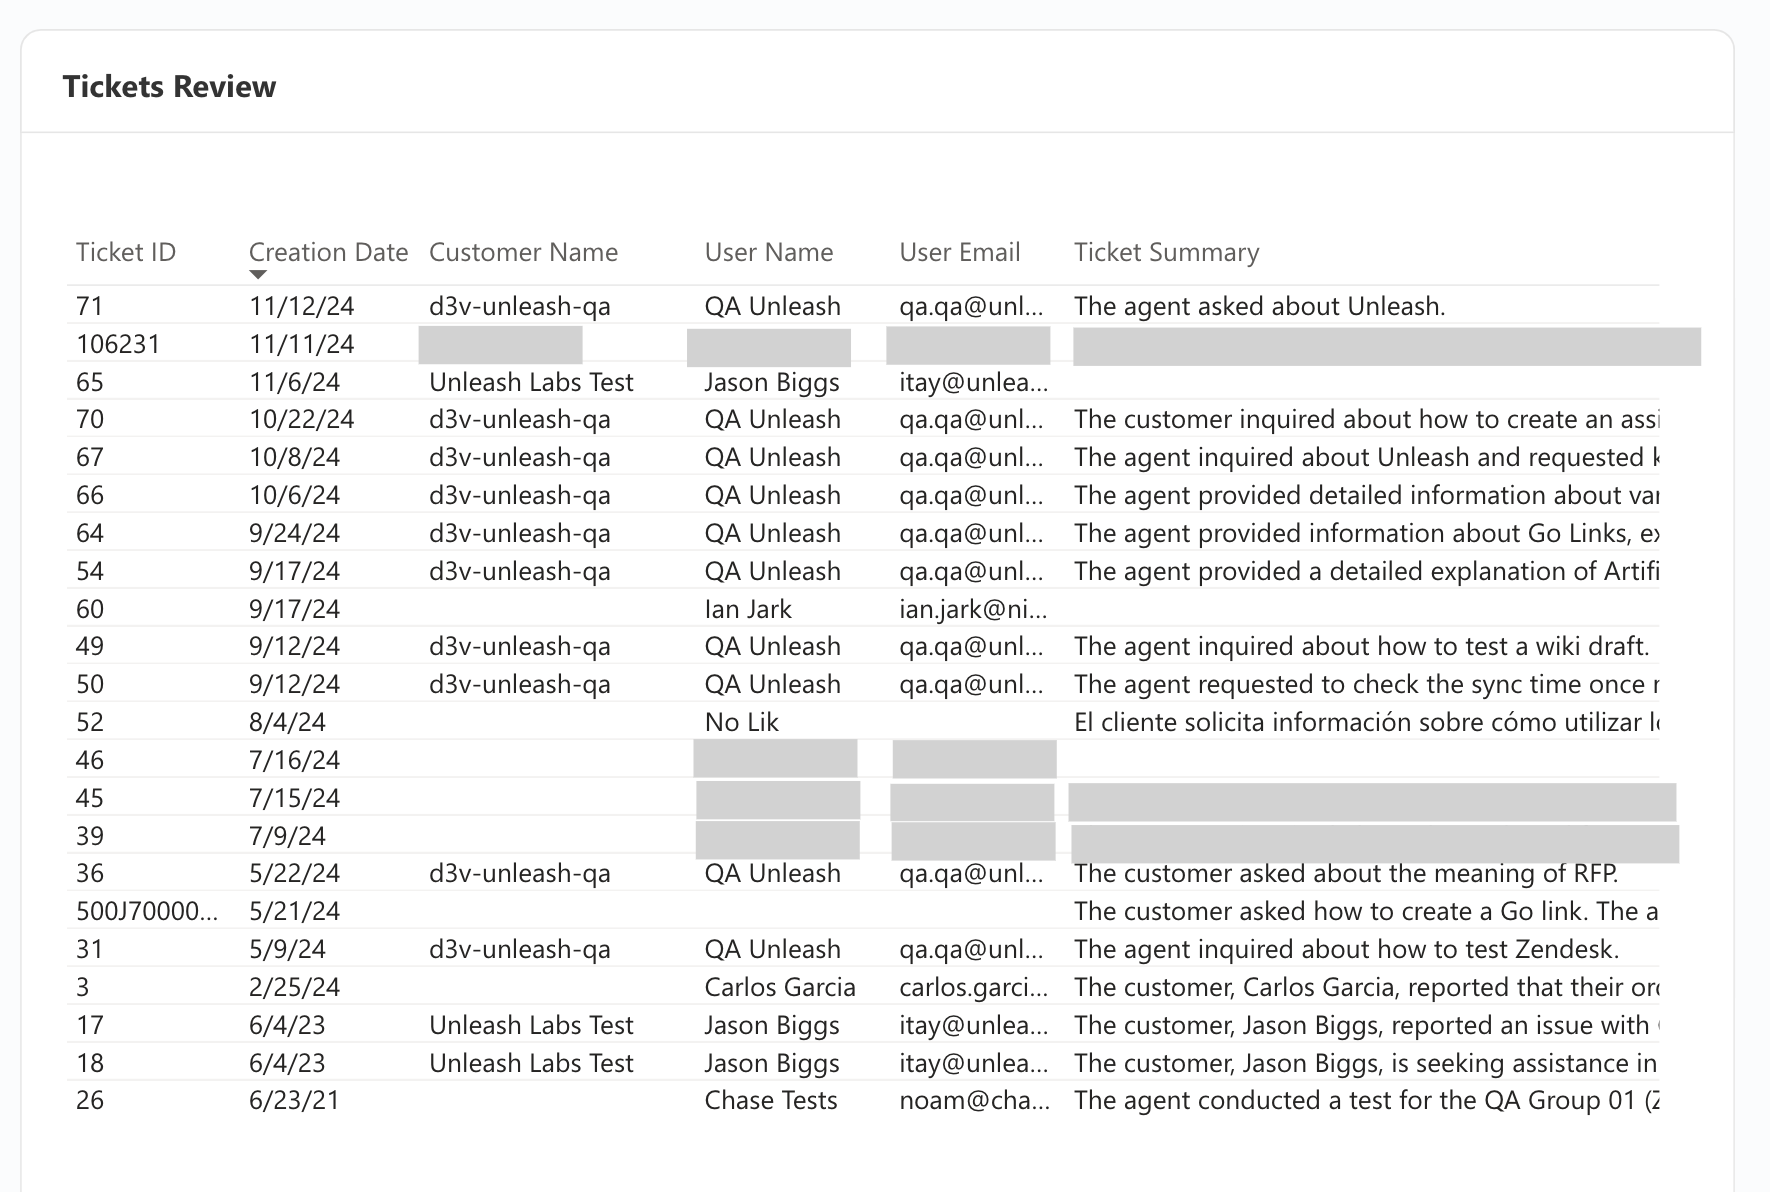
Tickets Review
Review the ticket summary generated by the Zendesk and Salesforce bot, including sentiment, key ticket/case details, the user query, resolution, agent name, feedback type, and the reason for any negative feedback. This report helps you assess both the quality of the bot's responses and user satisfaction.
API
Daily Number of Questions
Track the number of questions asked daily.

Q&A Data Question Level
Access a comprehensive list of queries and answers asked in your interfaces. This includes:
User Name: Account name of user that asked the query.
Queries: The actual query that was asked.
Answer: Answer provided to the query.
Answer Status: Which queries were answered.
This detailed view allows you to improve documentation for unanswered queries.
Expert Validation
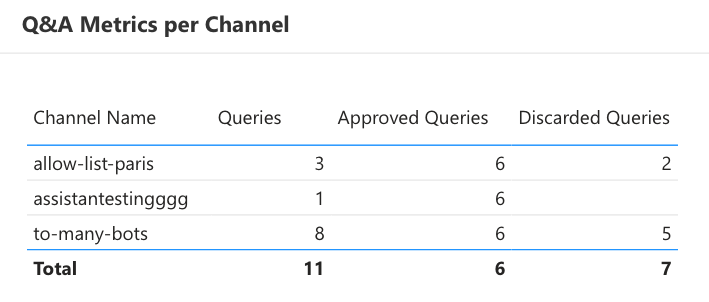
Q&A Metrics per Channel
This tab provides visibility into Q&A metrics per channel, showing the number of questions asked, how many were approved, and how many were discarded. This allows you to assess the relevance and quality of answers as validated by the knowledge experts assigned to each channel.
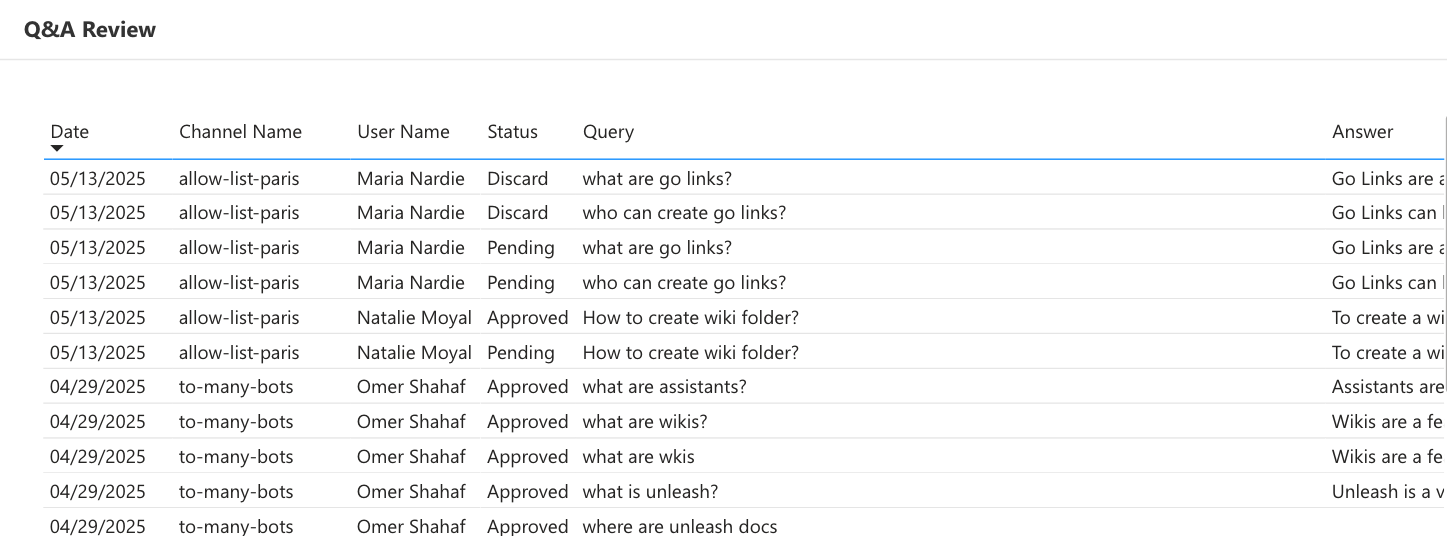
Q&A Review
View the channel name, user name, query, provided answer, status of the response (approved/discarded), and the expert who reviewed it. This helps ensure transparency and continuous improvement in the answers delivered.
